
Part 15 — How I Run My Entire Digital Life on a Raspberry Pi: Monitor the Monitors — Real-Time Docker Metrics with cAdvisor
Table of Contents
Ever wondered what’s really happening inside your Docker containers? Imagine having a crystal-clear, real-time dashboard showing exactly how much CPU, memory, disk, and network your apps are using — without any guesswork or manual digging. That’s where cAdvisor (short for Container Advisor) steps in, and it does so with the pedigree of Google’s own infrastructure.
 Monitoring the monitors — Image generated by chatGPT
Built and battle-tested by the engineers who keep services like Gmail and YouTube running at global scale, cAdvisor is your secret weapon for container visibility. It automatically discovers every running container on your host, collects a rich stream of performance and resource metrics, and exposes them via a slick web UI and a powerful API. What makes cAdvisor especially exciting? It’s lightweight, requires zero changes to your containers, and plugs seamlessly into monitoring stacks like Prometheus and Grafana for beautiful, actionable dashboards. From CPU spikes to memory leaks, from network bottlenecks to disk thrashing — cAdvisor tracks it all, live and in detail.
Deploy
Let’s create a new stack in our Portainer and copy the following to it:
services:
  cadvisor:
    image: gcr.io/cadvisor/cadvisor:latest
    container_name: cadvisor
    privileged: true
    restart: unless-stopped
    ports:
      - "8080:8080"
    volumes:
      - /:/rootfs:ro
      - /var/run:/var/run:ro
      - /sys:/sys:ro
      - /var/lib/docker/:/var/lib/docker:ro
      - /dev/disk/:/dev/disk:ro
    devices:
      - /dev/kmsg:/dev/kmsg
    dns: 172.30.1.3
    networks:
      pi_docker_network:
        ipv4_address: 172.30.1.24

networks:
  pi_docker_network:
    external: true
As you can see, nothing special is set, just the required host-based indicators to be mapped into the container, thus cAdvisor can have adequate access to the required information. We can deploy this stack easily and we are mostly done.
Prometheus config
Next, to make it available in Grafana, we need to configure Prometheus to scrape our cAdvisor. Go to /docker/monitor/prometheus and edit prometheus.yml and add the following to the scrapers.
  - job_name: 'cAdvisor' #for cadvisor
    static_configs:
      - targets: ['172.30.1.24:8080']
Grafana config
Add a new dashboard, for which the easiest to use the community’s collection. Among the available options, I found the cAdvisor exporter as the best option.
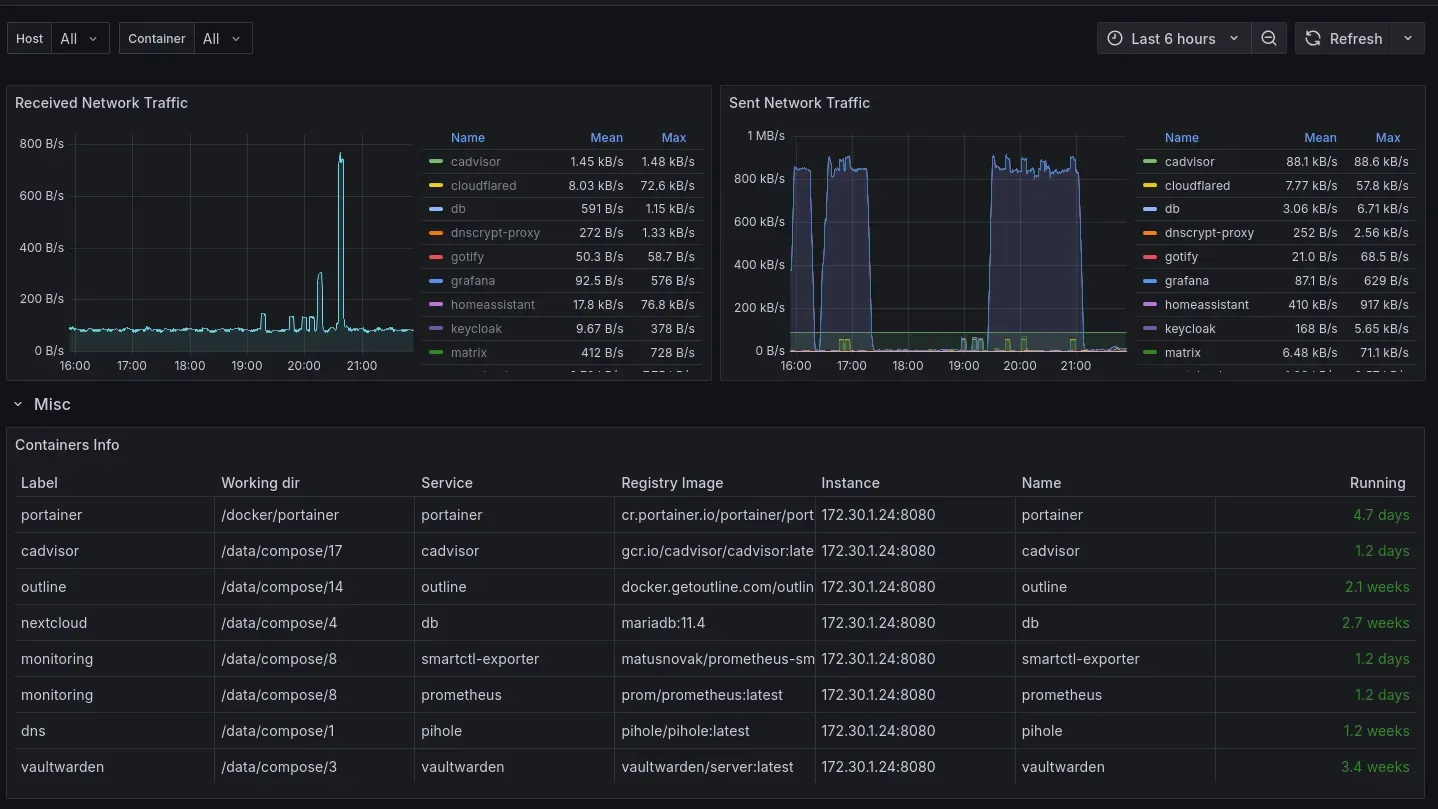 Snippet from what is avaiable via cAdvisor
Schrödinger’s cat?
When you first set up your Raspberry Pi to run Docker containers, you expect it to be a lean, mean, monitoring machine — until you realize that cAdvisor, the very tool meant to keep tabs on your resources, is itself gobbling up the most CPU and memory. It’s like Schrödinger’s cat, but instead of a feline in a box, you’ve got a monitoring process that’s both helping you and haunting your system’s performance at the same time. You might wonder: is cAdvisor a helpful observer, or is it the noisy neighbor who keeps borrowing your WiFi while you’re trying to stream? Before you open the box, you hope for the best, but once you peek inside, you’ll see the truth: sometimes, the watcher is the one who needs watching
 CPU usage of each container
Ultimately, it’s your call whether cAdvisor is a good fit for your setup — but if you’ve got the spare capacity to run it, you can quickly set up Grafana alerts to catch any container that suddenly starts gobbling up all your resources.
Unleashing the Power of Graylog: Centralized Logging for Docker on Raspberry Pi
Graylog stands out as a robust, open-source log management and Security Information and Event Management (SIEM) platform, designed to centralize, secure, and analyze machine-generated data from a vast array of sources. Whether you’re monitoring IT operations, investigating security incidents, or ensuring compliance, Graylog delivers real-time threat detection, powerful dashboards, and flexible alerting — all through an intuitive web interface. Its modular architecture allows you to parse, enrich, and route logs with ease, making it a favorite among DevOps and security teams who need actionable insights from their log data.
To feed Docker container logs directly into Graylog, you have several options — but one of the most efficient is using the built-in Docker GELF (Graylog Extended Log Format) logging driver, or a lightweight agent like Filebeat. With the GELF driver, every container can send its logs (STDOUT and STDERR) to a Graylog instance simply by passing the right logging options at startup.
For example, running a container with the --log-driver=gelf and --log-opt gelf-address=udp://<graylog-ip>:12201 will stream all logs directly into Graylog’s GELF input. Alternatively, Filebeat can be deployed as a sidecar or on the host to collect logs from Docker’s JSON log files and forward them to Graylog, offering more granular control and reliability.
Now, let’s talk Raspberry Pi. While Graylog is a powerhouse, it’s also resource-hungry, especially when running alongside its required dependencies — Elasticsearch for indexing and MongoDB for storage. Even on a Raspberry Pi 4 with 4GB or 8GB of RAM, Graylog can consume a significant chunk of available resources. Elasticsearch alone is recommended to have at least 2GB of RAM, Graylog itself around 1GB, and MongoDB is lighter but still demands its share. If you’re already running 10+ other services — like databases, web apps, or monitoring tools — Graylog’s appetite for memory and CPU can quickly overwhelm your Pi. Add in the fact that log management involves constant disk writes, and your microSD card may not last long under the strain.
So, is Graylog on a Raspberry Pi a good idea for a home lab or small-scale setup? The answer is: it depends. If you’re curious and want to experiment, Graylog on a Pi can be a fun and educational project — especially if you keep your log volume low and use external storage for Elasticsearch data.
But for serious log management with multiple services and high log throughput, your Raspberry Pi will likely be overburdened. In such cases, consider running Graylog on more powerful hardware or in the cloud, where it can truly shine without constantly bumping into resource constraints. For those ready to push their Pi to the limit, Graylog offers a glimpse into the world of professional log analytics — just be prepared for a few performance trade-offs along the way!
While Graylog offers powerful centralized logging and log analysis, running it on a Raspberry Pi — especially alongside a dozen or more services — quickly becomes impractical due to its hefty resource demands. Graylog’s dependencies, including Elasticsearch and MongoDB, can easily push your Pi’s memory and CPU to the breaking point, resulting in sluggish performance and potential instability. For most hobbyists and small-scale setups, this makes Graylog a heavyweight contender best reserved for more robust hardware or cloud environments.
On the other hand, cAdvisor remains a lightweight and efficient choice for monitoring resource consumption per container. It provides real-time insights into CPU, memory, and disk usage, all without overtaxing your Raspberry Pi. Even in resource-constrained environments, cAdvisor proves its worth by keeping watch over your containers, making it a viable and practical solution for those who want to keep tabs on their Docker workloads without the overhead of a full-fledged log management platform. However, it still very likely that cAdvisor will consume the most amount of CPU clock cycles :)