
Part 10 — How I Run My Entire Digital Life on a Raspberry Pi: Effortless Device Monitoring with Grafana, Node Exporter, and Prometheus
Table of Contents
Get ready to supercharge your smart home monitoring! In this episode, we’re bringing together the powerhouse trio of Grafana, Prometheus, and node-exporter to create a live dashboard that tracks your devices like never before. We’ll set up node-exporter to collect detailed system metrics, use Prometheus to gather and store all that data, and then unleash Grafana’s stunning visualizations to turn raw numbers into real insights. Whether you want to keep tabs on your Raspberry Pi, smart plugs, or any gadget on your network, you’ll soon have a customizable, real-time overview of your home’s health and performance — all in one sleek dashboard. Let’s dive in and unlock the secrets of your smart home’s data!
 Image generated by ChatGPT
Grafana
Grafana is a powerful open-source analytics and visualization platform that lets you monitor, analyze, and alert on data from a wide variety of sources — all in real time. With Grafana, you can create highly customizable dashboards that transform raw metrics, logs, and traces into interactive graphs, charts, and tables, making it easy to track performance, spot trends, and gain deep insights into your systems. Its seamless integration with popular data sources like Prometheus, InfluxDB, and Elasticsearch, along with robust alerting features, enables you to stay on top of critical events and make data-driven decisions with confidence.
![A Grafana dashboard [Source: https://grafana.com/grafana/]](/_astro/img-01.oqNCLCi-_1t4eXJ.webp) A Grafana dashboard [Source: https://grafana.com/grafana/]
A Grafana dashboard [Source: https://grafana.com/grafana/]
Promethus
Prometheus is an open-source systems monitoring and alerting toolkit designed to collect, store, and analyze metrics as time-series data, each tagged with labels for powerful filtering and aggregation. Originally developed at SoundCloud and now a Cloud Native Computing Foundation project, is ideal for monitoring dynamic microservices and cloud-native environments, so it is just ideal for our Raspberry pi. It also integrates seamlessly with visualization tools like Grafana, hence we are going to rely on it here too.
![Promethus logo [source: https://logodix.com/prometheus]](/_astro/img-02.FsrYYN8h_18HJ6L.webp) Promethus logo [source: https://logodix.com/prometheus]
Promethus logo [source: https://logodix.com/prometheus]
Node Exporter
Node Exporter is a lightweight, open-source agent designed to collect and expose a wide range of hardware and operating system metrics from Linux systems, making it an essential component for monitoring server health and performance. It gathers detailed data on CPU usage, memory, disk I/O, filesystem statistics, network traffic, and running processes by leveraging built-in metric collectors. Node Exporter runs on each monitored machine and makes these metrics available on port 9100, where they can be scraped by Prometheus for storage and analysis. This setup enables real-time visibility into the health and status of your infrastructure, providing the foundational data for Grafana dashboards and alerting systems.
+1: Smartctl Exporter
Smartctl Exporter is an open-source Prometheus exporter that collects and exposes S.M.A.R.T. (Self-Monitoring, Analysis, and Reporting Technology) statistics from your hard drives using the smartctl tool. By running smartctl exporter on your system, we make detailed disk health and reliability metrics available for Prometheus to scrape, allowing you to visualize and monitor drive status and anticipate potential hardware failures through platforms like Grafana. This helps us keep a close eye on our encrypted storage and take action before problems arise.
Our stack
Let’s build our stack for this powerful trio.
services:
  node-exporter:
    container_name: node-exporter
    restart: unless-stopped
    image: quay.io/prometheus/node-exporter:latest
    hostname: node-exporter_local
    command:
      - "--path.rootfs=/host"
    network_mode: host
    pid: host
    volumes:
      - "/:/host:ro,rslave"
      - "/etc/localtime:/etc/localtime:ro"

  smartctl-exporter:
    container_name: smartctl-exporter
    hostname: smartctl-exporter_local
    restart: unless-stopped
    image: matusnovak/prometheus-smartctl:latest
    privileged: true
    # user: root
    # ports:
    #   # - "9633:9633"
    #   - "9902:9902"
    volumes:
      - "/etc/localtime:/etc/localtime:ro"
    dns: 172.30.1.3
    networks:
      pi_docker_network:
        ipv4_address: 172.30.1.21

  prometheus:
    container_name: prometheus
    restart: unless-stopped
    image: prom/prometheus:latest
    hostname: prometheus
#    ports:
#      - "9090:9090"
    volumes:
      - "/etc/localtime:/etc/localtime:ro"
      - "/mnt/storage/docker/monitoring/prometheus/prometheus.yml:/etc/prometheus/prometheus.yml"
    dns: 172.30.1.3
    networks:
      pi_docker_network:
        ipv4_address: 172.30.1.22
    depends_on:
      - node-exporter
      - smartctl-exporter

  grafana:
    container_name: grafana
    restart: unless-stopped
    image: grafana/grafana:latest
    hostname: grafana
    volumes:
      - "/etc/localtime:/etc/localtime:ro"
      - "/mnt/storage/docker/monitoring/grafana:/var/lib/grafana:rw"
    environment:
      - GF_AUTH_DISABLE_LOGIN_FORM=false
      - GF_AUTH_ANONYMOUS_ENABLED=false
      - GF_SECURITY_ALLOW_EMBEDDING=true
    dns: 172.30.1.3
    # ports:
    #   - "3000:3000"
    networks:
      pi_docker_network:
        ipv4_address: 172.30.1.20
    depends_on:
      - node-exporter
      - smartctl-exporter
      - prometheus

networks:
  pi_docker_network:
    external: true
Do not deploy yet! Continue reading.
Most of the docker-compose.yml lines must be very familiar to you after all these episodes. Let’s talk a bit about certain new things.
Node Exporter: As you can see, the first container in the stack is Node Exporter. Similarly to Home Assistant, to work seamlessly with the underlying hardware as well as to gather information from other devices on your LAN, it has to be running in network_mode: host, and we need to “indicate” that in the command section too. Again, since it is running in network_mode: host , we do not have to set any IP address for the container.
Smartctl Exporter: There is no need for such a sophisticated setup as for node exporter, but the container should run in privilegedmode, and that setting solves everything.
Prometheus: Since this is basically just the datasource the previous two can report to, no special privilege has to be set. We mount though a prometheus.yml config file that we will setup before deployment. This describe, from which sources and under what name and settings the data will be gathered. Let’s create that prometheus.yml file now:
global:
  scrape_interval: 5s
  external_labels:
    monitor: 'prometheus_pi'
scrape_configs:
  - job_name: 'prometheus'
    static_configs:
      - targets: ['172.30.1.22:9090']
  - job_name: 'node-exporter'
    static_configs: #here you define where you run a node-exporter
      - targets: ['172.30.1.1:9100']
  - job_name: 'smartctl-exporter' #localhost
    static_configs: #here you define where you run a smartctl-exporter
      - targets: ['172.30.1.21:9902']
    relabel_configs:
      - source_labels: [__address__]
        regex: '.*'
        target_label: instance
        replacement: 'pi'
This prometheus.yml configuration file sets Prometheus to scrape metrics every 5 seconds and labels all data with monitor: 'prometheus_pi'. It defines three scrape jobs: one for Prometheus itself running at 172.30.1.22:9090, one for Node Exporter at 172.30.1.1:9100(which is running in network_mode:host), and one for Smartctl Exporter at 172.30.1.21:9902. Additionally, for the Smartctl Exporter job, a relabeling rule renames the instance label to “pi” for easier identification in the monitoring dashboard. Note, there is no need to set the scraping interval to lower than 5 seconds, as Grafana’s lowest refresh window is 5s.
Grafana: As with our previous setups, we’re providing persistent storage for Grafana. However, there’s a common pitfall to watch out for: by default, the Grafana container runs as the root user (just as any container). But if you pre-create the /mnt/storage/docker/grafana directory as the pi user on your Raspberry Pi, the container won’t have the necessary permissions to write to it. If you let Portainer create the directory, it’ll be owned by your local root user, but the root group still won’t have write access, which can cause issues. My usual solution is to create the directory as root and then set the permissions so Grafana can access it without problems.
# mkdir -p /mnt/storage/docker/monitoring/grafana/
# chmod -R 775 /mnt/storage/docker/monitoring/grafana
Here’s a brief explanation of each Grafana-related environment variable in your container configuration:
- GF_AUTH_DISABLE_LOGIN_FORM=false This keeps the login form enabled, meaning users must authenticate with a username and password to access Grafana.
- GF_AUTH_ANONYMOUS_ENABLED=false This disables anonymous access, so users cannot view dashboards or data without logging in.
- GF_SECURITY_ALLOW_EMBEDDING=true This allows Grafana dashboards to be embedded in other web pages or applications via iframes, which is useful if you want to display Grafana panels elsewhere
Alright, let’s deploy our stack. Check all containers’ log and look for success or error. The logs are quite self-explanatory. If all went fine, create a new subdomain to reach Grafana remotely.
Configure tunnel
Go to your Cloudflare tunnel dashboard, select the tunnel you have established already, and add a new public hostname that will redirect to the Grafana container at port 3000.
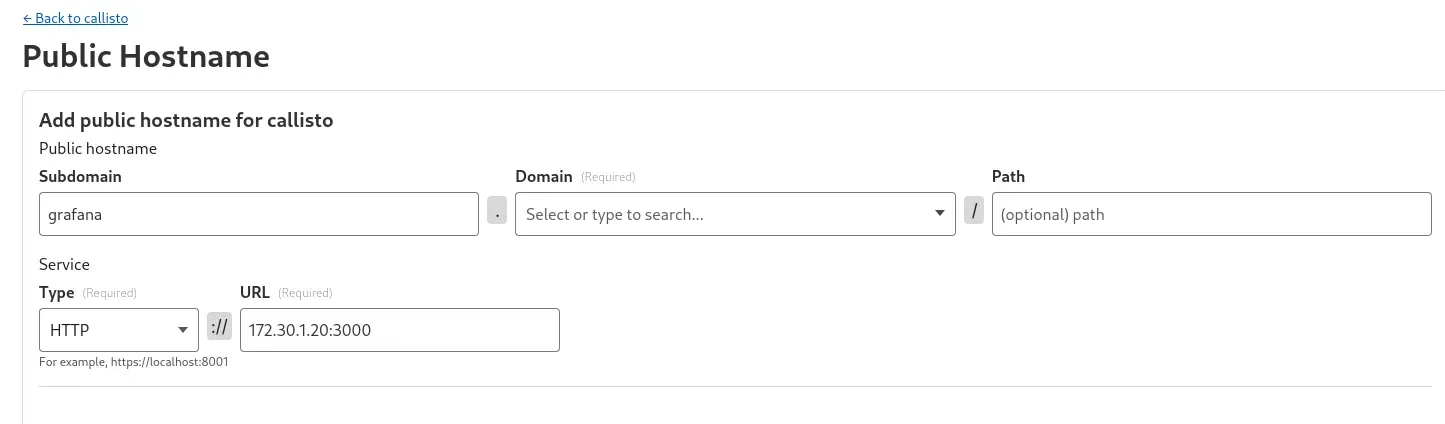 Create a new public hostname that redirects to Grafana
As you will only access Grafana through a web browser, it makes sense to set additional access policy to this domain, e.g., Cloudflare’s Zero-trust OTP service.
Extra security
Let’s create a new Access policy by navigating to Access->applications.
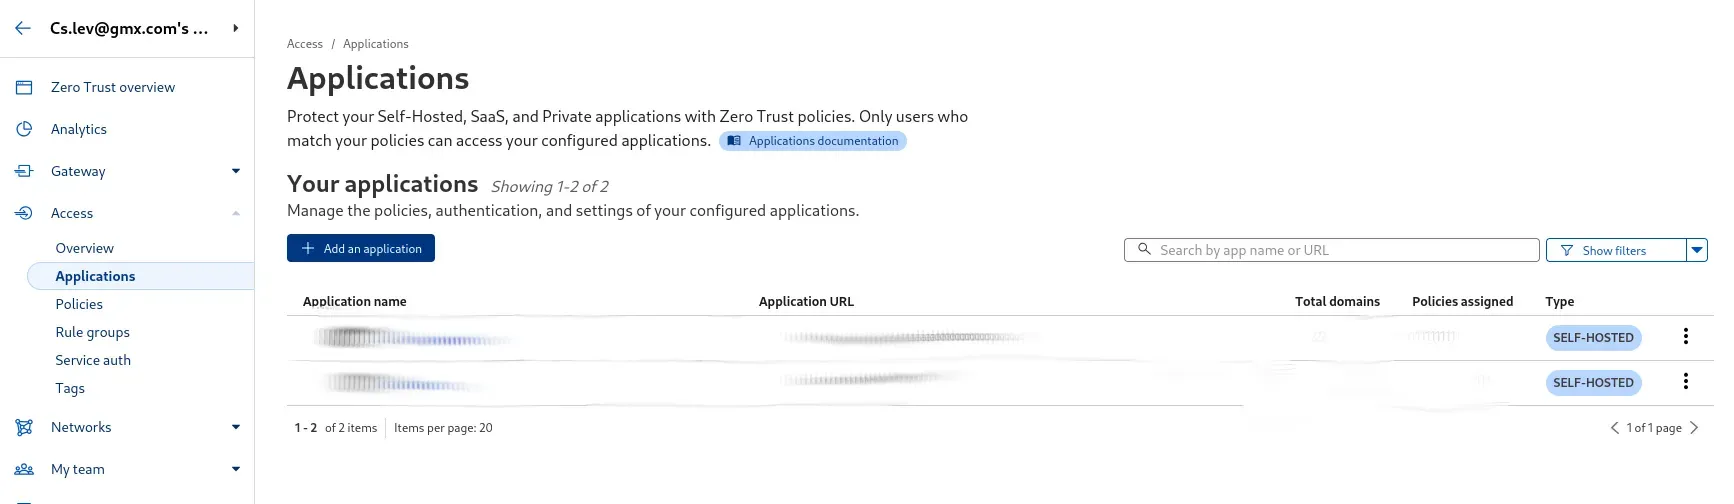 Create a new application
Click on Add an application, then select self-hosted on the next screen on the left.
 Create a self-hosted application
Next, give your application a name and specify a hostname as well. While you can always set the hostname later in the settings, it’s more convenient to do it right from the start.

Then, at the bottom, click on Create new policy, and let’s define our access control there. Set a name and leave the Action as it is (Allow). Set Session duration to default (24 hours) or extend it to avoid contiunous daily OTP-based authentication. Then, in the In the Rules section below, I typically select “Include” and choose “Emails,” then enter my specific email address without using a wildcard. However, you can use a wildcard if you want — for example, to grant access to everyone in your department, simply enter @mydepartment.mycompany.com. Here, I just want myself exclusively to have access.
 Add email-based rule
Here’s how it basically works: when someone tries to access your public hostname, Cloudflare presents a form asking for their email address and then sends a one-time passcode (OTP) to that address. The catch is, if the email isn’t on the Include list, Cloudflare simply won’t send an OTP — even though the user interface makes it look like an OTP is on its way to the email they entered.
Note, this is an extra security layer provided by Cloudflare; you still need to login to Grafana or any of your services subsequently. Then, go back to your application setup, and choose the policy that we just created for Access policies.
 Choose the policy we just created
 Select the policy and Confirm
You can leave the rest below as it is, and just click on Next. Then, you can do some customization if you want.
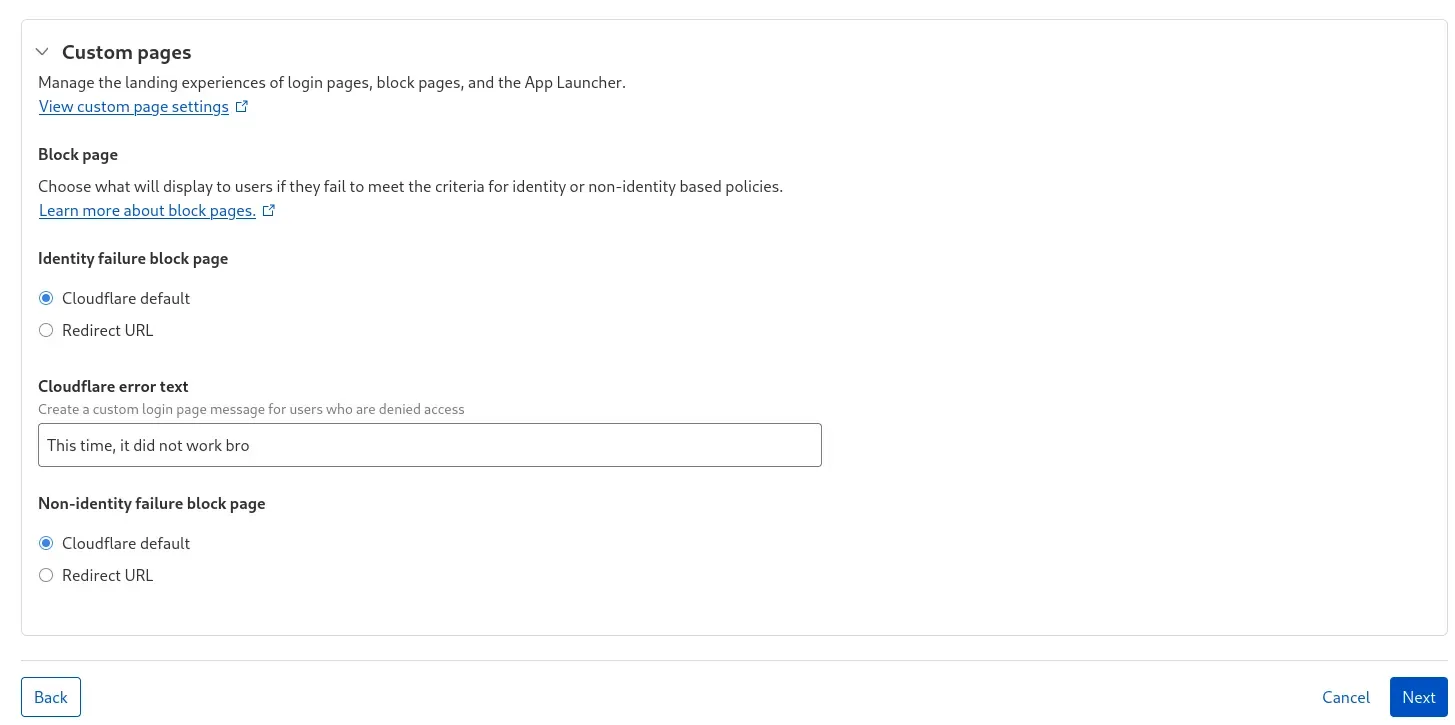 Customize message :)
On the next page, you can simply accept the default values and click Save, or take some time to explore additional options for more detailed customization. Once everything is set up, you’ll see your new application listed, along with confirmation that it’s now applied to one of your domains — specifically, your Grafana domain.
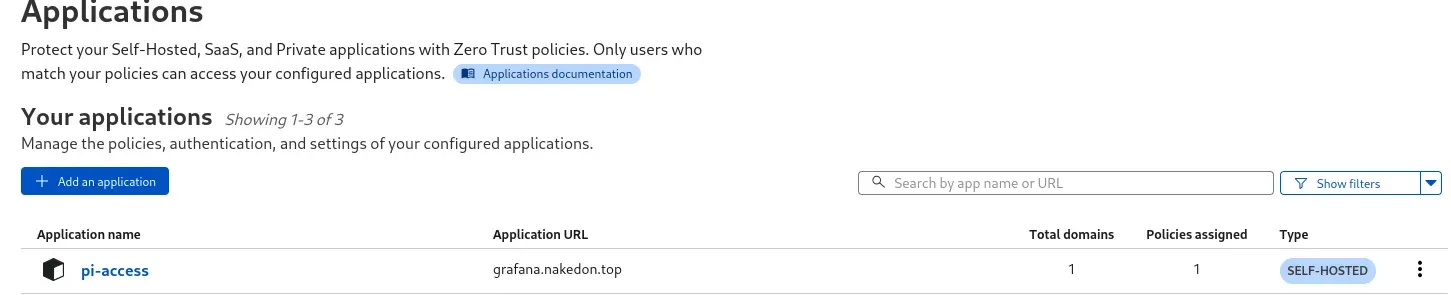 The application is deployed
Let’s test. Navigate to your public hostname for grafana and see what it shows.
 Cloudflare Zero Trust has just been applied for your service
As you can see, everything is working just as intended. We’ve successfully added a simple, Zero Trust-based layer of security — without even needing to know the ins and outs of Zero Trust or realizing that’s exactly what we were implementing!
Once I got the OTP, log in as admin/admin, change the password, and let’s see our Grafana dashboard. Let’s add connection to the Prometheus container, and setup some standard dashboard for a nice and quick monitoring. First, select Connection -> Add new connection on the left side panel.
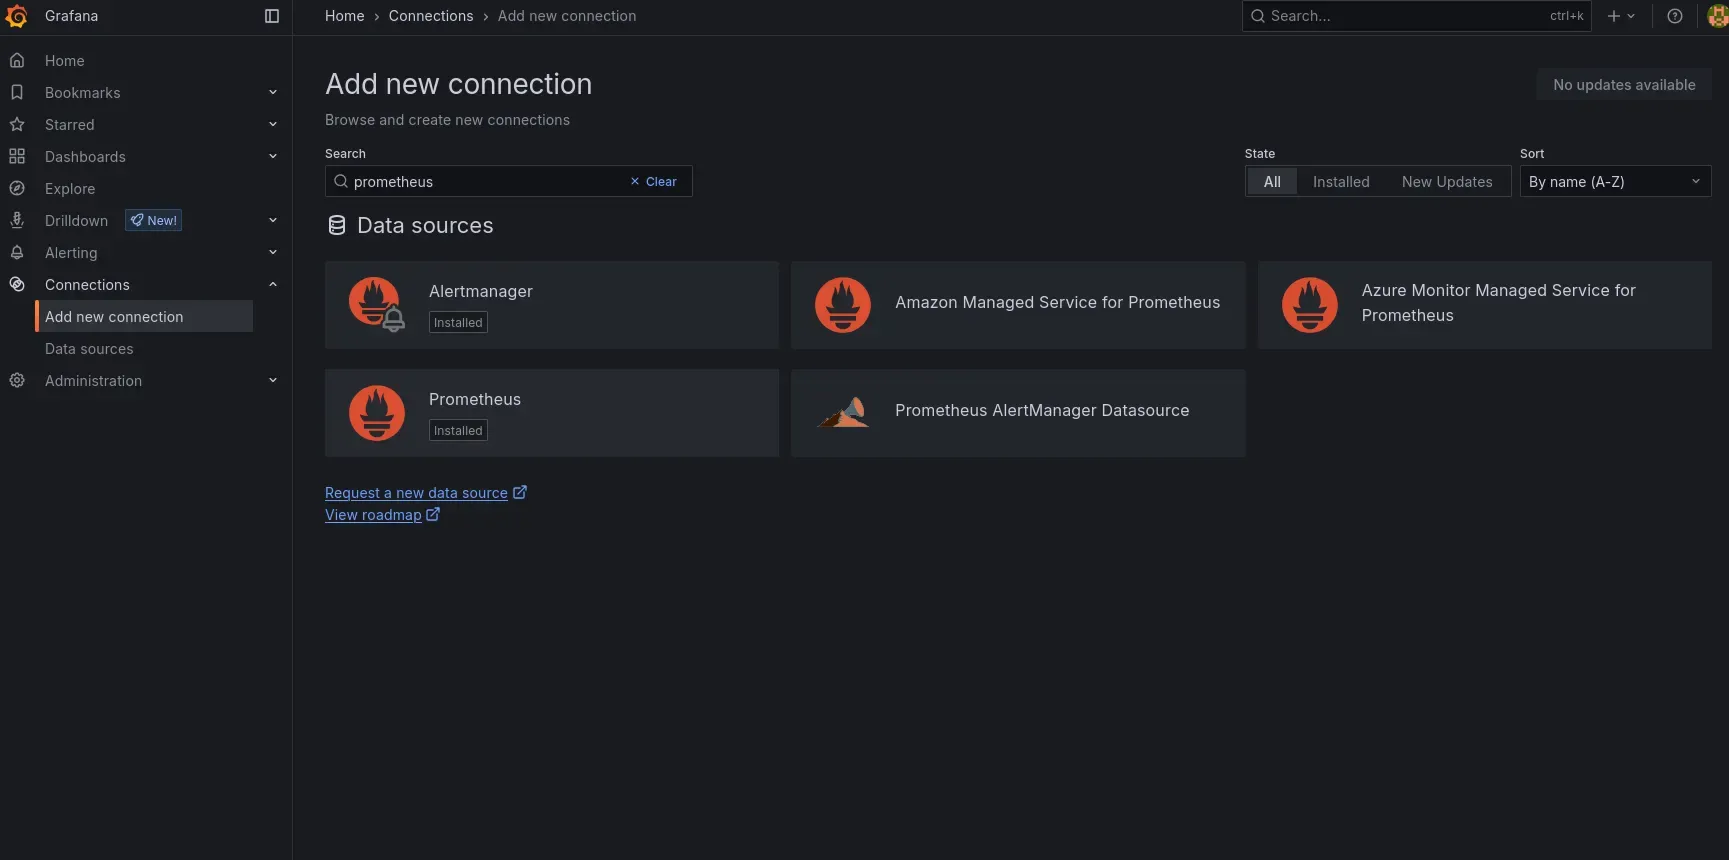 Filter on Prometheus
Filter on Prometheus and add it by selecting it (the one with the sole name of Prometheus).
Search for Prometheus and select the option labeled simply “Prometheus.”
Enter the URL for your local Prometheus container (http://172.30.1.22:9090). Since this Prometheus instance is running locally and doesn’t require any extra security settings, you can just scroll down and click on Save & test and look for the green confirmation tooltip.
 You only have to type in the correct URL for Prometheus
 After clickin on Save & Test
Next, go to the Dashboards, and click on the New button (on the top right corner) and select Import. Because, we won’t create anything from scratch, the community has already done a great job.
 Click on Import from the New menu
Let’s go afterwards to https://grafana.com/grafana/dashboards/, and search for node exporter, for instance.
 Search for node exporter
I am going to pick the dashboard on the top right corner.
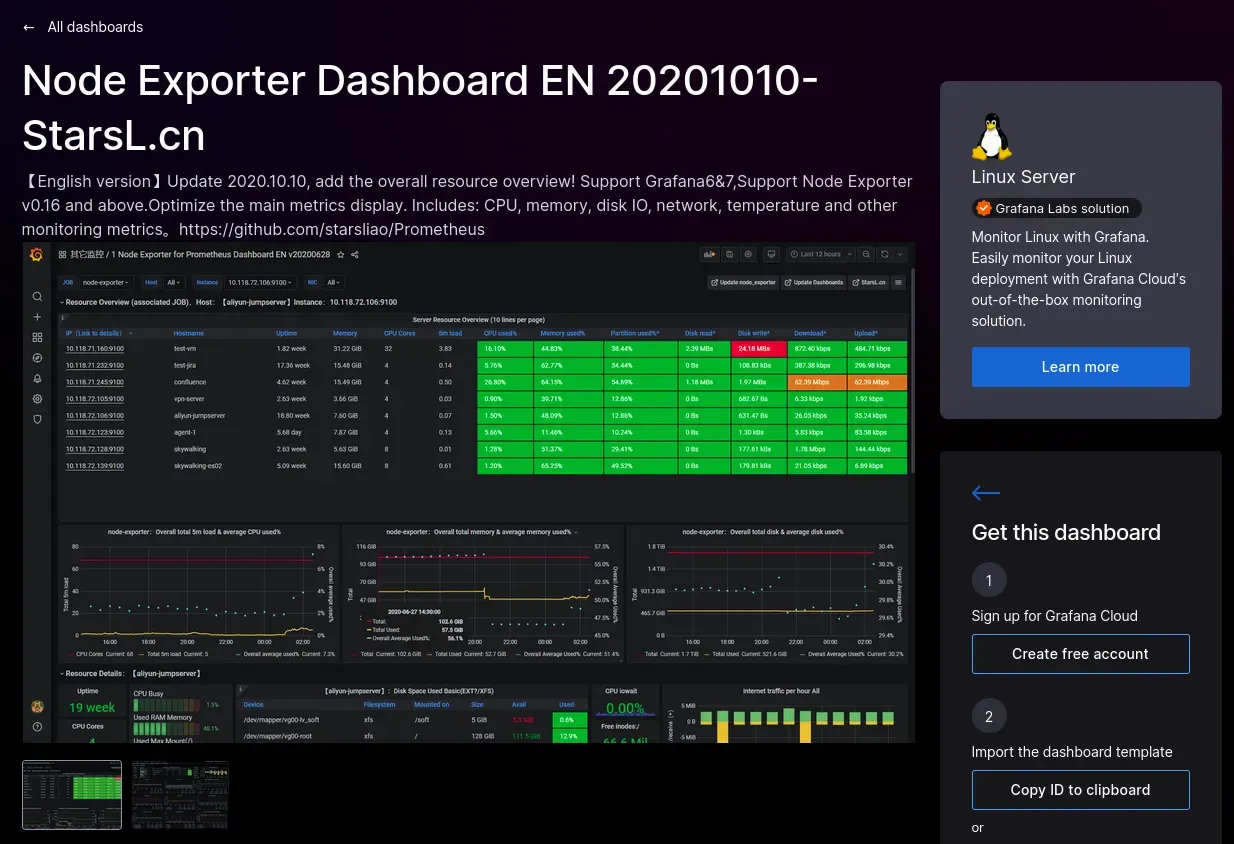 Details of the dashboard
After checking out the details, click on the “Copy ID to clipboard” on the right side and paste it into your Import field on your Grafana dashboard.
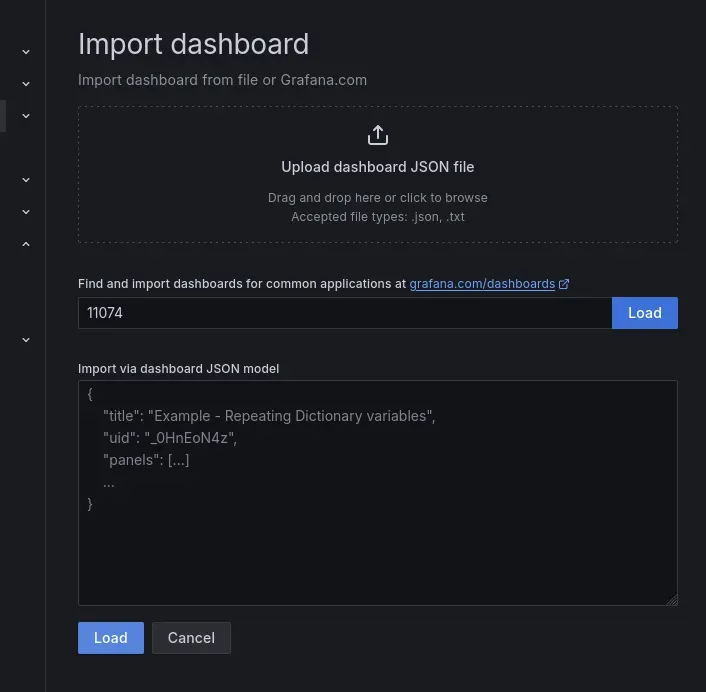 Paste the dashboard ID
Then click on load, and select your previously added Prometheus connection as the backend. Then, click on import.
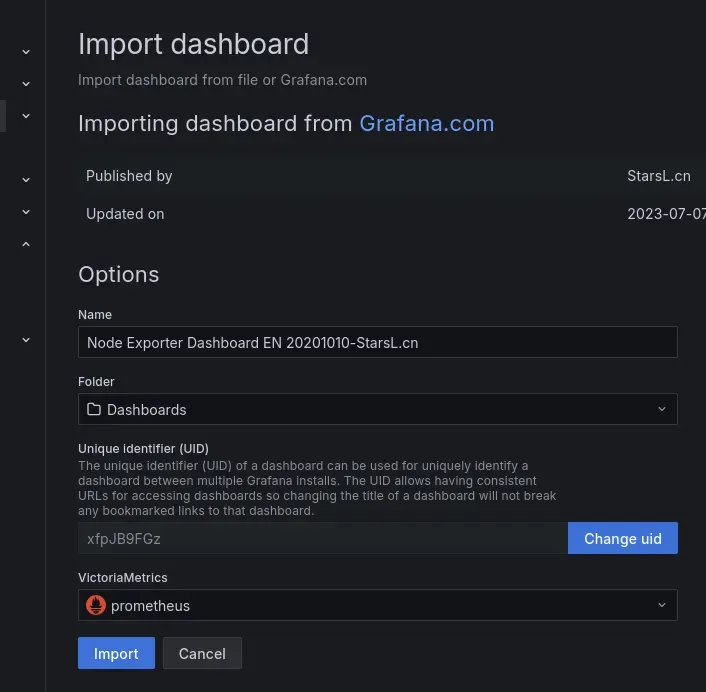 Don’t forget to select your Prometheus connection
Then, you will be brought to your freshly added dashboard.
 Our very own node exporter dashboard showing our own data
I’ve had Prometheus and node-exporter running for some time while working on this article, so my dashboards are already filled with plenty of data points. If you’re just getting started, you’ll likely see results begin to appear on the right side of your plots, gradually filling in the entire timespan as more data is collected.
Whether you’re using Smart Explorer or any other monitoring module in your stack, you can find and import dashboards directly from the Grafana main website. Each plot is fully customizable, allowing you to remove data points that don’t interest you. Like our previous posts, this article focuses not on Grafana configuration itself, but on helping you set up a complete monitoring stack on your Raspberry Pi. So, rather than diving deeper into Grafana details here, let’s link back to what we covered in the previous episode.
Create an alert to our Notification system. For this example, I simply set an alert for Grafana to send me a notification when the load of the Pi goes above a certain threshold. I selected this nice set of gauges and clicked on the Edit on its top right corner. Then, you will be brought to its detailed setting window.
 Create a new alert rule based on this plot
On the right side of the dashboard, you’ll notice that warning and critical thresholds are set to 70 and 90 by default. You can adjust these values if needed, but for now, let’s stick with them. To set up a new alert, click the top-right corner of the plot, select “More,” then choose “New alert rule.”
Give your alert a unique name. Below, you’ll see a list of Prometheus queries associated with this set of plots — these are displayed for reference, so you can identify how each query is labeled, but there’s no need to modify them.
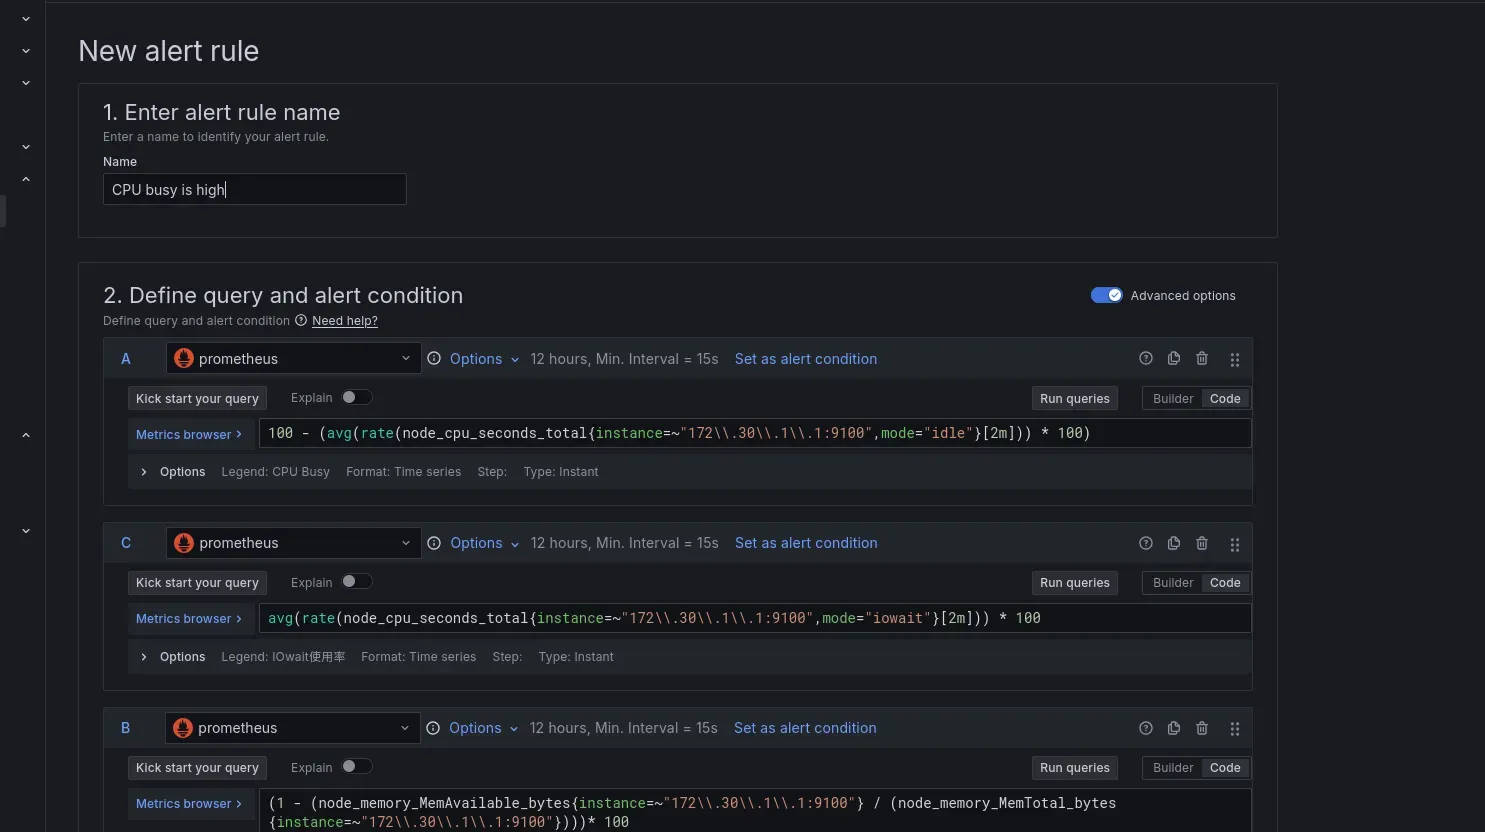 Set up the alert
Scroll down and you’ll find the option to select the query (such as “A”) and set your threshold value. You might see a prompt indicating that a Reduce function — selected by default — isn’t needed in this case, and suggesting that you convert the entire function directly into an alert condition instead. This streamlines the process, allowing you to base your alert directly on the query’s result and the threshold you specify. Create a folder and label too in section 3.
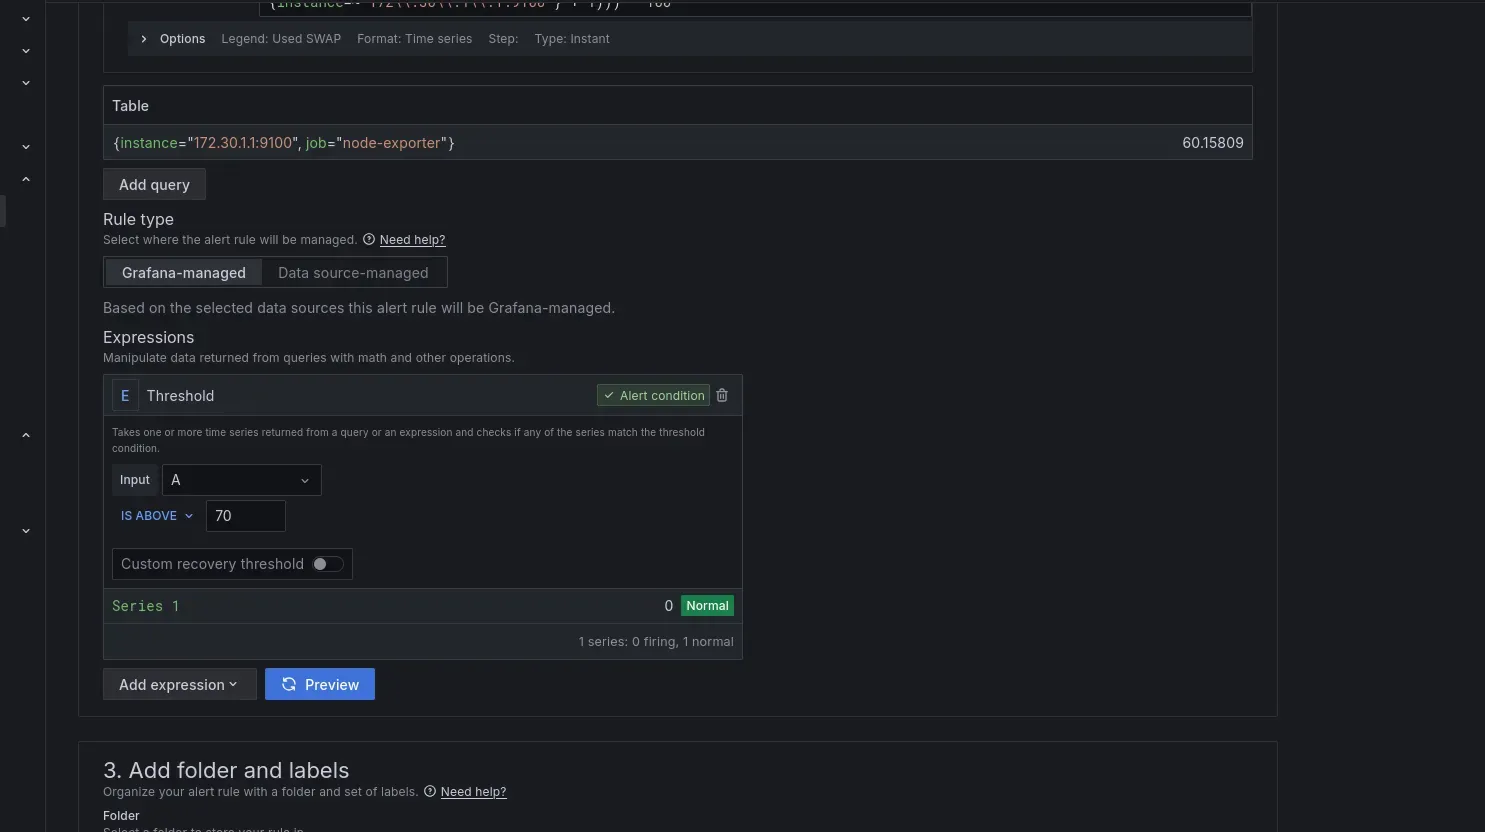 After defining, clickin on Preview will show if an alert would be triggered at the moment
For the evaluation behavior, I like to set a grace period — known as the pending period — to give my Pi time to recover in case the high usage is just a brief spike. I usually set this to 5 minutes, which means the CPU load must remain above 70% for a full 5 minutes before the alert is triggered.
 Evaluation behaviour setup
Similar applies to the Keep firing for setting. The description shown there explain the behavior itself. Before moving on, we need to select an evaluation group, like how often this alert should be checked. We don’t have anything yet, so click on +New evaluation group.
 A new evaluation group will evaluate our alert in every minute
Next, head to the Configure Notification section. At this stage, the only available option is to send an email, since no other notification methods have been set up yet. To enable Gotify notifications, first open Gotify and create a new application specifically for Grafana — this way, all dashboard alerts will appear in their own dedicated “container” within Gotify. Then, add a hook for Gotify by clicking on *“View or create contact points” *and creating a new contact point.
 Click on View or create contact points
Name your contact point as Gotify, and set integration to be a webhook.
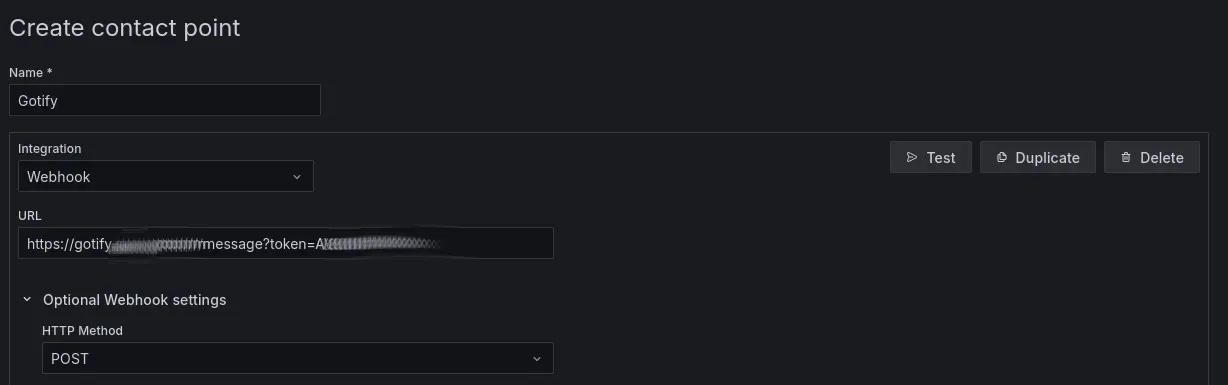 Configure webhook
Add your gotify URL with the token, the rest can be left intact. Click on Save contact point at the bottom. Go back to your alert setup, and choose the new contact point. Note, you might have to refresh the page to be able to select Gotify, which might loses your settings made so far :(
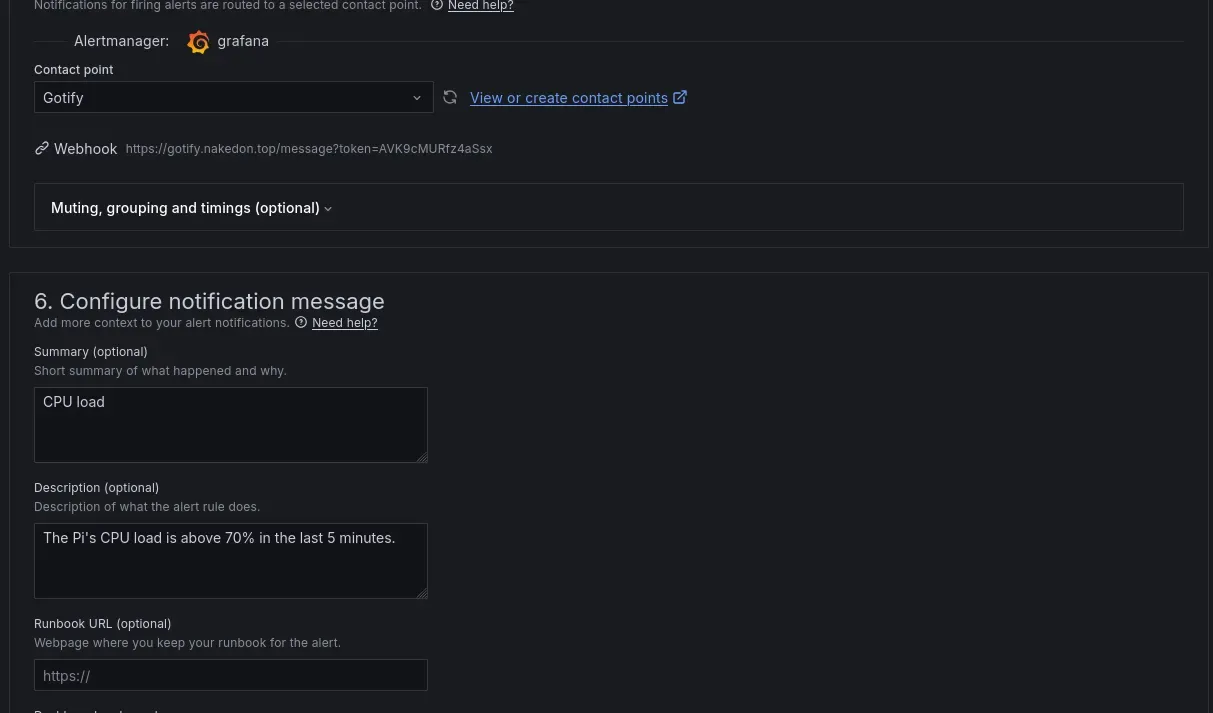 Select Gotify and add some details
Now, scroll back up and click the blue “Save rule and exit” button in the top right corner. With that, everything is set up. To view your newly created alerts, go to the left side panel and select Alerting → Alert rules.
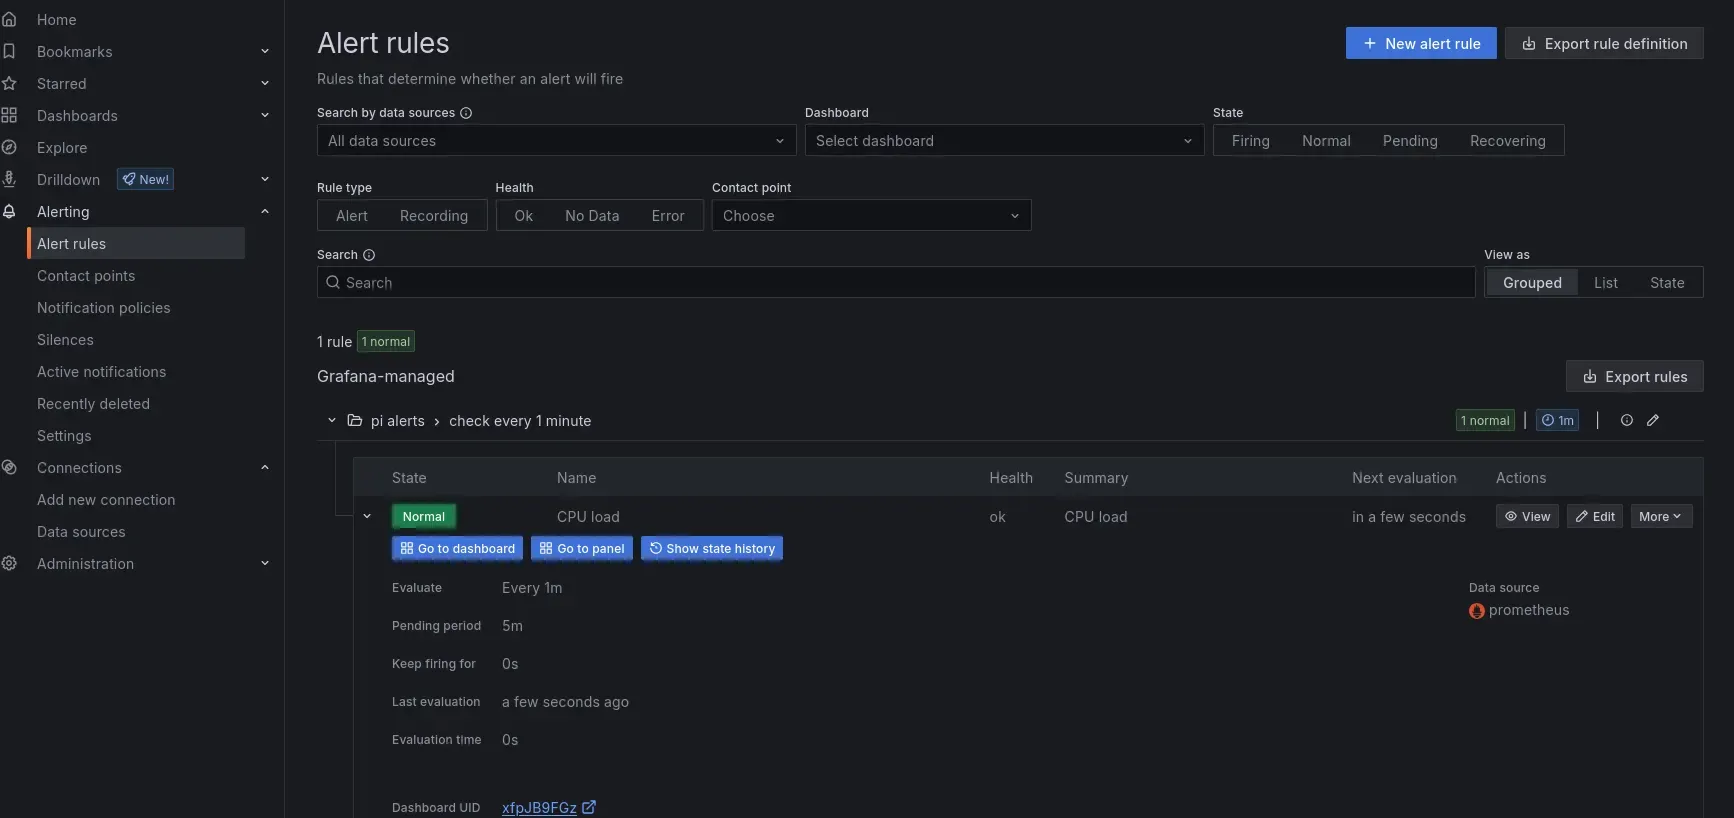 The freshly made Alert rule and its details
In conclusion, setting up a comprehensive monitoring stack on your Raspberry Pi using Prometheus, Node Exporter, Smartctl Exporter, and Grafana is both achievable and highly rewarding. With just a few configuration steps, you can gain valuable insights into your system’s health and performance, while adding effective alerting to stay ahead of potential issues. By leveraging these tools together, you build a robust, scalable monitoring solution that keeps your devices running smoothly and gives you peace of mind.
I hope you enjoy the series so far, and eager to explore the remaining ones :)